python各种鬼库
opencv库
fundamential operate
read and show image
open image
import matplotlib.pyplot as plt
import cv2
name = 'test'
def Show_image_cv2(title,sample_name):
    window1 = cv2.imshow(title, sample_name)
    cv2.waitKey(0)  # 0 mean any key to destroy, else is how much min to close
    cv2.destroyWindow(window1)

def Change_RGB(sample_name):
    if len(sample_name.shape) == 2:
        return '0', sample_name
    else:
        new = sample_name[:, :, :: -1]
        return '1', new

def Show_image_plt(sample_name):
    plt.figure(figsize=(5, 5))
    judge, image = Change_RGB(sample_name)
    if judge == '0':
        plt.imshow(sample_name, cmap='gray')
    else:
        plt.imshow(image)
    plt.show()

sample1 = cv2.imread('1.jpg', cv2.IMREAD_COLOR)  # point out which type to reed
sample2 = cv2.imread('1.jpg', cv2.IMREAD_GRAYSCALE)
# cv2.IMREAD_COLOR: color  ,    cv2.IMREAD_GRAYSCALE:  gray
print(type(sample1.shape))
plt.subplot(1,2,1), plt.imshow(sample1),plt.title('COLOR')
plt.subplot(1,2,2), plt.imshow(sample2, cmap='gray'), plt.title('GRAY')
plt.show()
# Show_image_plt(sample1)

cv2.imread()
two function meen which image need to open and open style
.shape()
if the image is colorful, it have there arguments, height, width, and 3, the third argument meen it’s a image with three channels
if return only two arguments, it meen it is a grayful image
remember : plt open image style is RGB, but opencv return is BGR
open mp4
import matplotlib.pyplot as plt
import cv2
sample = cv2.VideoCapture('sample_.mp4')
if_can = sample.isOpened()
cv2.namedWindow('mp4', cv2.WINDOW_NORMAL)
cv2.resizeWindow('mp4',750, 450)
while if_can:
    tem, flame = sample.read()
    if flame is None:
        break
    else:
        cv2.imshow('mp4',flame)
        if cv2.waitKey(1) & 0xFF == 27:
            break
cv2.destroyAllWindows()

color channel pick_up
import matplotlib.pyplot as plt
import cv2
def Change_GPG(image):
    return image[:,:,::-1]
sample = cv2.imread('1.jpg')
carve_image = sample[:450, 200:750]
r, g, b = cv2.split(sample)
r_only, g_only, b_only = sample.copy(), sample.copy(), sample.copy()
r_only[:,:,0] = r_only[:,:,1] = 0
g_only[:,:,0] = g_only[:,:,2] = 0
b_only[:,:,1] = b_only[:,:,2] = 0
plt.subplot(2,2,1,), plt.imshow(Change_GPG(carve_image)), plt.title('carve'),
plt.subplot(2,2,2), plt.imshow(Change_GPG(r_only)), plt.title('r_only')
plt.subplot(2,2,3), plt.imshow(Change_GPG(g_only)), plt.title('g_only')
plt.subplot(2,2,4), plt.imshow(Change_GPG(b_only)), plt.title('b_only')
plt.tight_layout()
plt.show()

edge fullfill style
import matplotlib.pyplot as plt
import cv2
def Change_GPG(image):
    return image[:,:,::-1]
sample = cv2.imread('1.jpg')
top, bottem, left, right = (100, 100, 100, 100)  # fill length
first = cv2.copyMakeBorder(sample, top, bottem, left, right, cv2.BORDER_REPLICATE)
second = cv2.copyMakeBorder(sample, top, bottem, left, right, cv2.BORDER_REFLECT)
third = cv2.copyMakeBorder(sample, top, bottem, left, right, cv2.BORDER_REFLECT101)
fourth = cv2.copyMakeBorder(sample, top, bottem, left, right, cv2.BORDER_WRAP)
fifth = cv2.copyMakeBorder(sample, top, bottem, left, right, cv2.BORDER_CONSTANT, value=0)
"""
BORDER_REPLICATE:复制法,也就是复制最边缘像素。
BORDER_REFLECT:反射法,对感兴趣的图像中的像素在两边进行复制例如:fedcba|abcdefgh|hgfedcb
BORDER_REFLECT_101:反射法,也就是以最边缘像素为轴,对称,gfedcb|abcdefgh|gfedcba
BORDER_WRAP:外包装法 cdefgh|abcdefgh|abcdefg
BORDER_CONSTANT:常量法,常数值填充。
"""
plt.subplot(2,3,1), plt.imshow(Change_GPG(sample)), plt.title('original')
plt.subplot(2,3,2), plt.imshow(Change_GPG(first)), plt.title('BORDER_REPLICATE')
plt.subplot(2,3,3), plt.imshow(Change_GPG(second)), plt.title('BORDER_REFLECT')
plt.subplot(2,3,4), plt.imshow(Change_GPG(third)), plt.title('BORDER_REFLECT101')
plt.subplot(2,3,5), plt.imshow(Change_GPG(fourth)), plt.title('BORDER_WRAP')
plt.subplot(2,3,6), plt.imshow(Change_GPG(fifth)), plt.title('BORDER_CONSTANT')
plt.tight_layout()
plt.show()

image overlying
import matplotlib.pyplot as plt
import cv2
def Change_GPG(image):
    return image[:,:,::-1]
sample = cv2.imread('1.jpg')
sample2 = cv2.imread('3.jpg')
print(sample.shape)
print(sample2.shape)
sample2 = cv2.resize(sample2,(899,899))
# res = cv2.resize(img, (0, 0), fx=4, fy=4) 等比缩放
# if two image size is not same,we must resize them
new = cv2.addWeighted(sample, 0.5, sample2, 0.5, 0)
plt.imshow(Change_GPG(new))
plt.show()

image threshold
import matplotlib.pyplot as plt
import cv2
def Change_GPG(image):
    return image[:,:,::-1]
def Show_plt(vertical, level, image, title):
    for pr in range(1,(vertical*level) + 1):
        plt.subplot(vertical, level, pr), plt.imshow(image[pr-1],cmap='gray'), plt.title(title[pr-1])
    plt.tight_layout()
    plt.show()
sample = cv2.imread('1.jpg', cv2.IMREAD_GRAYSCALE)
tem1, first = cv2.threshold(sample, 127, 255, cv2.THRESH_BINARY)
tem2, second = cv2.threshold(sample, 127, 255, cv2.THRESH_BINARY_INV)
tem3, third = cv2.threshold(sample, 127, 255, cv2.THRESH_TRUNC)
tem4, fourth = cv2.threshold(sample, 127, 255, cv2.THRESH_TOZERO)
tem5, fifth = cv2.threshold(sample, 127, 255, cv2.THRESH_TOZERO_INV)
image = [sample, first, second, third, fourth, fifth]
title = ['original', 'THRESH_BINARY', 'THRESH_BINARY_INV', 'THRESH_TRUNC', 'THRESH_TOZERO', 'THRESH_TOZERO_INV']
Show_plt(2,3,image,title)

tkinter库
init tkinter
turtle库
initial turtle
import turtle
turtle.setup(500, 500, 20, 20)
turtle.done()

turtle.setup(width, height, startx, starty) have four arguments, first is the window’s width,second is the window’s height,third is the distence between the window’s left and your screen’s left, fourth is the distence between the window’s top and your screen’s top. if the third and fourth argument is none, the default argument is to your screen centre.
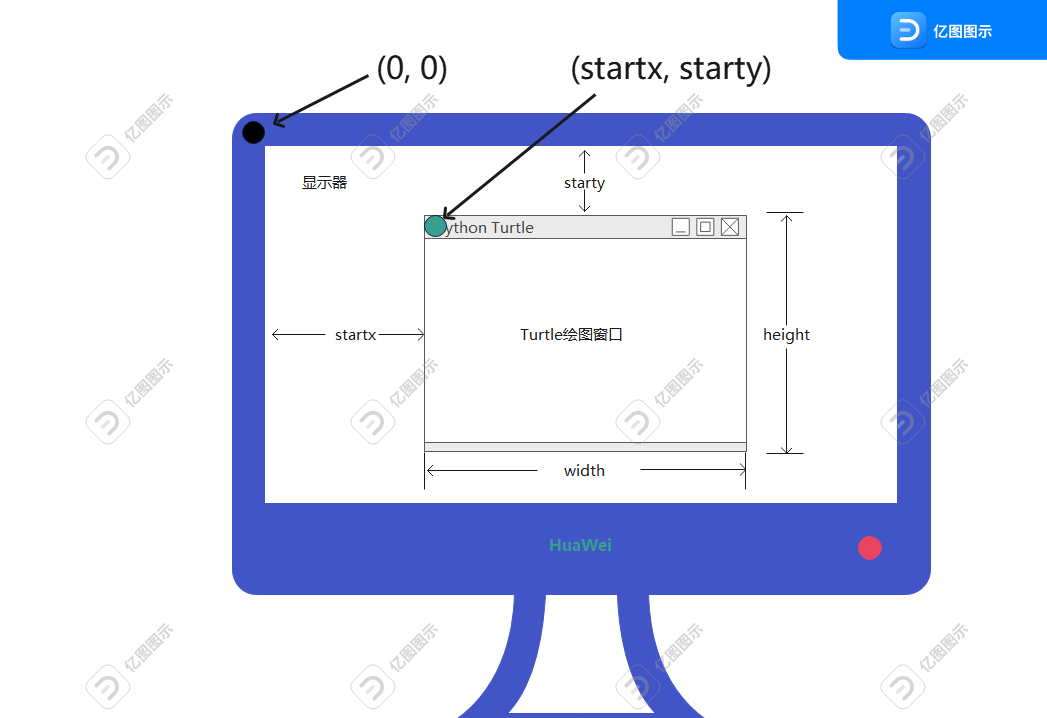
if we don’t have turtle.done(), the turtle will disappear when the process is end
fundamential operate
move
import turtle
turtle.setup(500, 500)
turtle.fd(100)  # turtle.forward(100)
turtle.goto(50, 50)
turtle.bk(100)  # turtle.backward(100)
turtle.circle(50, 90)
turtle.seth(180)
turtle.circle(50)
turtle.circle(-100, -90)
turtle.left(100)
turtle.fd(50)
turtle.right(50)
turtle.bk(50)
turtle.done()

turtle.forward(distence)
let the pen move forward distence pixts . it can be shorthanded by ‘turtle.fd(distence)’
turtle.backward(distence)
let the pen move backward distence pixts, it can be shorthanded by ‘turtle.bk(distence)’
turtle.circle(r, angle)
if the argument of angle is none , the default argument is 360. r and angle can be a nagative number, it mean counterclockwise
turtle.goto(x, y)
let the pen go to the x, y
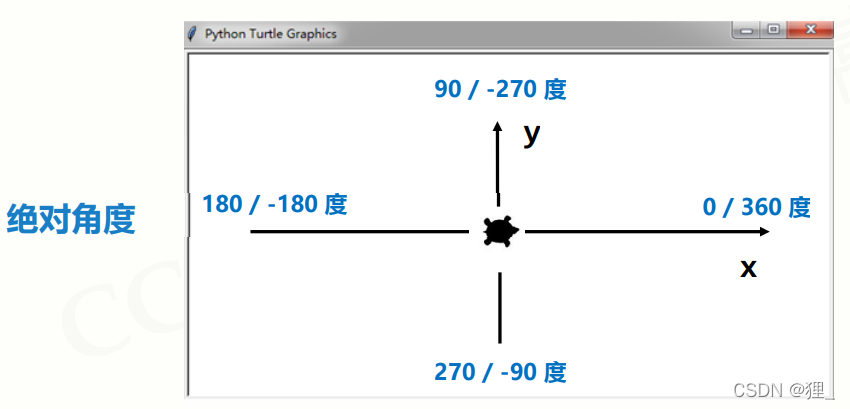
turtle.seth(angle)
let the direction of pen change to the angle of absolute of coordinate system
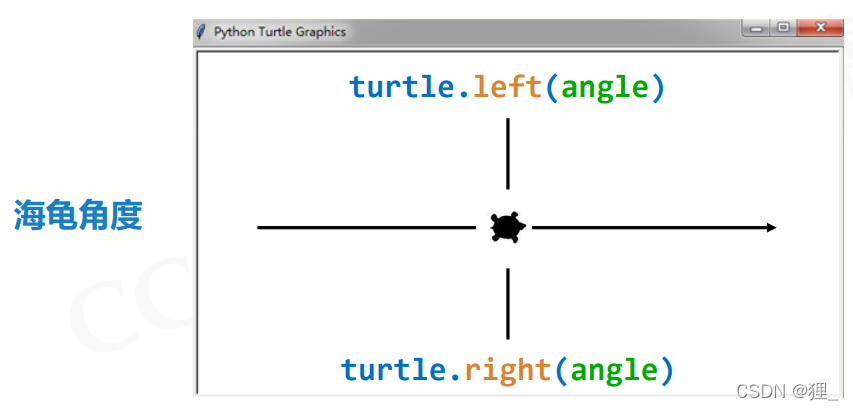
turtle.left(angle) / turtle.right(angle)
let the direction of pen rotate to the left(right) angle of the turtle coordinate system
absolute coordinate system
turtle coordinate sytem
pen
import turtle
def paintLine():
    for pr in range(10):
        turtle.fd(10)
        if pr % 2:
            turtle.down()
        else:
            turtle.up()

turtle.setup(500, 500)
paintLine()
turtle.left(90)
turtle.fd(50)
turtle.left(90)
turtle.pensize(5)
turtle.pencolor('pink')
paintLine()
turtle.pencolor((1, 1, 0))
paintLine()
turtle.colormode(255)
turtle.pencolor((0, 0, 255))
paintLine()
turtle.done()

turtle.penup(),turtle.pendown()
those can be shorthand by ‘turtle.up(), turtle.down()’,ment let the pen move but don’t paint
turtle.pensize(size)
change the size of the pen
turtle.pencolor()
the first method is put the color to the type os string .the second methd is to use RBG to set color
turtle.colormode(mode)
the default form of show RGB is float, we can use this function to change it,
when we put 1.0 , it can be set to float, when we put 255 in it , it can be set to the int form
other operate
import turtle
turtle.setup(500, 500)
turtle.speed(1)
turtle.forward(50)
turtle.hideturtle()
turtle.goto(50, 50)
# turtle.isvisible()
turtle.done()
turtle.speed(number)
set the speed of painting , bigger the number is , faster the speed is.
turtle.hideturtle() / turtle.showturtle()
hide or show the turtle
turtle.isvisible()
judge if the turtle is be held, return type of bool
jieba库
matplotlib.pyplot库
import matplotlib.pyplot as plt
import random
from math import sin, cos, sqrt
import numpy as np
X, Y = [], []
for pr in range(1, 11):
    X.append(0.1*pr)
for pr in range(1, 11):
    Y.append(random.random())
plt.figure(figsize=(7,4))
plt.plot(X, Y, color='pink', linestyle='-', linewidth=1, marker='*', markerfacecolor='yellow',
         markeredgecolor='black', markersize='10', markeredgewidth=2)
"""
linestyle:线的类型 : --,-,:,-.
marker:设置中心点的形状
markerfacecolor:设置点中心的颜色
markeredgecolor:设置点边缘颜色
markersize:设置点的大小
markeredgewidth:点边缘的大小
"""
first = plt.gca()
first.set_title("first matplotlib title", fontname='Arial', fontsize=20, weight='bold', style='italic')
# fontname字体 fontsize字号 weight粗体 style斜体
first.set_xlabel('x_info')  # fontname='Arial', fontsize=10, weight='bold'
first.set_ylabel('random_info')
plt.show()

fundamential operate
plt.figure(figsize=(x,y))
set the canvas initial size, x mean length, y meen width
plt.plot(……)
first and second arguments are required tpye of list, mean x and y infomation.also have other arguments
color , linestyle, linewidth, marker, markerfacecolor, markeredgecolor, markersize, markeredgewidth
plt.gca()
it mean took out this cooidinate system and return a label to operate this coordinate system
.set_title(….)
this function must use gca return lable, to set this coordinate system title,
have five argument : naem fontname字体 fontsize字号 weight粗体 style斜体
.set_xlable() / .set_ylabel()
this function must use gca return label, to set x or y mean
have four argument : name , fontname字体 fontsize字号 weight粗体
linestyle argument have

color shorthand allowed

.set_xticks()
first.set_xticks([0.2, 0.4, 0.8])

.set_xticklabels()
first.set_xticklabels(['A','B','C'])

.tick_params()
axis : {‘x’, ‘y’, ‘both’} Axis on which to operate; default is ‘both’. reset : bool If True, set all parameters to defaults before processing other keyword arguments. Default is False. which : {‘major’, ‘minor’, ‘both’} Default is ‘major’; apply arguments to which ticks. direction : {‘in’, ‘out’, ‘inout’} Puts ticks inside the axes, outside the axes, or both. length : float Tick length in points. width : float Tick width in points. color : color Tick color; accepts any mpl color spec. pad : float Distance in points between tick and label. labelsize : float or str Tick label font size in points or as a string (e.g., ‘large’). labelcolor : color Tick label color; mpl color spec. colors : color Changes the tick color and the label color to the same value: mpl color spec. zorder : float Tick and label zorder. bottom, top, left, right : bool or {‘on’, ‘off’} controls whether to draw the respective ticks. labelbottom, labeltop, labelleft, labelright : bool or {‘on’, ‘off’} controls whether to draw the respective tick labels. labelrotation : float Tick label rotation
first.tick_params(axis='x',width=10,color='gold',length=50,direction='in',
                  labelcolor='gold',pad=10,labelsize=30)

subgraph setting
import matplotlib.pyplot as plt
import random
from math import sin, cos, sqrt
import numpy as np
X, Y = [], []
for pr in range(1, 11):
    X.append(0.1*pr)
for pr in range(1, 11):
    Y.append(random.random())
fig, ax = plt.subplots(2, 1)  # 一列多少行 一行多少列
ax[0].plot(X, Y)
ax[1].plot(X, Y)
plt.show()